Spring 2021 arrived with a large percentage of the Western U.S. exhibiting below-average precipitation, in some places a lot below the 15-year mean. Matt Reeves discusses current conditions and potential ecological responses, and Shannon Neibergs analyzes livestock management options, including current cattle markets, hay supply, and herd management scenarios.
[ Music ]
>> Welcome to the Art of Range, a podcast focused on range lands and the people who manage them. I’m your host Tipp Hudson, range and livestock specialist with Washington State University Extension. The goal of this podcast is education and conservation through conversation. Find us online at artofrange.com.
[ Music ]
Welcome back to the Art of Range. My guests today are Matt Reeves and Shannon Neibergs. Matt is a research ecologist with the forest service out of Montana, and Dr. Neibergs is the director for the Western Center for Risk Management Education and a livestock economist, and we have kind of some emerging news across the country the last few weeks. In places like the Northwest, we’ve had nearly average or above average snow pack but below average lower elevation precipitation, and drought conditions seem to be emerging in other parts of the country that we thought it’d be worthwhile to talk about for a little bit. Matt Reeves runs a program called Fuelcast. The [inaudible] of this based on satellite data, and Shannon is an economist that has some suggestions on how livestock producers might be able to respond to the current drought situation. So, we’re going to jump in and begin talking about the situation. Matt and Shannon, welcome.
>> Hi Tipp. Thanks for having me.
>> Likewise.
>> Well, Matt can you give the 30,000 foot view of what things look like across the West right now?
>> Yes, and what I’ll be describing Tipp is regarding the forage and fuel conditions to start with, and one of the headlines, I guess you could say, is starting about four weeks ago we noted that at least 80% of the western U.S. the forage conditions were below average, and below average doesn’t sound like much but that was a unique condition that we hadn’t seen in our 40-year record of observation, plus or minus 40 years. Some things have improved slightly in the last couple of weeks due to some timely moisture and a few other things we’ll talk about, but overall places like California and up in through Eastern Oregon, Eastern Washington have been very dry, and that has shown in the forage conditions. Likewise, the upper, you know the Northern Great Plains, particular in North Dakota, have been exceptionally dry and that is also reflecting in forage conditions.
>> Yeah, I think some of that probably is not going to surprise many people that have looked out their window or out the door or the pickup window. What are some of the metrics that you’re using to measure those conditions?
>> Well, my primary metric that I’m using for most of my work now is the change in forage conditions as monitored and projected using the Fuelcast system, and Fuelcast is a computer program that runs on the Google Earth engine, and it uses weekly satellite remote sensing, daily precipitation, and daily ettie [phonetic], which is a drought metric in its formulation, and it looks ahead and it starts four months before the peak at every location in the western U.S. and begins to make projections every week about the expected forage conditions. And so we use that primarily to track what’s happening with forage. You know, if we were just gearing to precipitation, we can sometimes get, you know, some false impressions about what that means for forage because, depending on where we’re at, rainfall is not all created equal in the timing and intensity and all these things. So, we need, in my opinion, a computer program using machine learning or artificial intelligence to be able to unravel some of those complicated things.
>> Just to better understand some of that, how does the Fuelcast assessment compare with, for example, the U.S. Drought Monitor, which more people would be familiar with?
>> Well, the U.S. Drought Monitor, as you know, is derived from a lot of people looking at a variety of metrics, some of which may be related to forage. Like, for example, using satellite derived NDVI or Normalized Vegetation Index and other things, and then it’s kind of a– It’s my understanding that the Drought Monitor is kind of an amalgamation of a whole bunch of different indicators, but the primary difference here would be it’s kind of a generic viewpoint of drought. In other words, you know, the water storage facilities may have say 50% capacity, and that would indicate a drought, but that is not one to one with what we would expect with forage. So, we’re focused just on the forage and fuel component, and obviously there’s a relationship between drought and the forage amount, but you start talking about the timing and what the drought means for cool season versus warm season species and it gets pretty complicated, and that’s why we’re kind of of the opinion that allowing a computer to sort through it all can offer some advantages in some instances when we’re just talking about forage.
>> Right. What are the areas that seem to be the worst off right now?
>> The worst areas in terms of reductions of forage, I would say first off would be California and Eastern Oregon. Eastern Washington, I think, in the last week or so is definitely we noticed a little blip to the up side. So, conditions have improved slightly, but they’ve got a long way to come out of the hole. Yeah, and in North Dakota these are some of the worst yield conditions we’ve seen in quite some time, but I don’t believe they compare to the types of reductions that we’re seeing in California. I think that’s probably the number one attention grabbing headline would be what’s happened in California.
>> You mentioned in the webinar that there are a number of conditions independent; a number of conditions besides just fuel availability and dryness that contribute to fire risk, and one of the big ones is standing dead. Can you describe how that plays into the model and what those numbers look like?
>> Yes. Standing dead is something we estimate and keep track of. So, the standing dead estimate we have at fuelcast.net was derived using data from 2020 because that’s what came forward to this growing season, of course; all that sonest [phonetic] material. And our view of the standing dead is that it’s just a function of what was produced last year. So, if there was say; let’s just say 1000 pounds per acre of annual production produced last year, then there would be a certain amount of that sonest material brought forward this year, and where that really begins to influence things is when we start looking at potential fire behavior and the surface fire behavior film model, for those of you that speak that language. So, we incorporate the standing dead plus whatever kind of productivity we expect this year into our fuel amounts, which has direct implications for fire behavior.
>> And what would be some of the reasons for there being a lot of standing dead in particular regions; a good year last year for precipitation?
>> Well, that’s right. Well, not only precipitation because as you and I have talked about sometimes precip can fool us because if the precipitation doesn’t come at the right time or if it’s too hot or if it’s, you know, cool season species and yet we get precip in July, that’s not going to do us a whole lot of good. So, yes to answer your question about the standing dead, if an area had a good year last year in terms of forage productivity, then the assumption is that there’s a good bit of standing dead that’s brought forward. That assumption isn’t always true. For example, if it’s really matted down by a ton of snow it may still be sonest material, but it’s laying kind of horizontally. So, it’s a different kind of environment, and we don’t have the complexity and the model to look at that.
>> It’s laying dead instead of standing dead.
>> Yeah, or if there is, you know, some late fall kind of early winter grazing that may occur, then we’re not tracking that very well either because we’re not directly sensing the amount of standing dead. We’re estimating as a function of what happened in the years past.
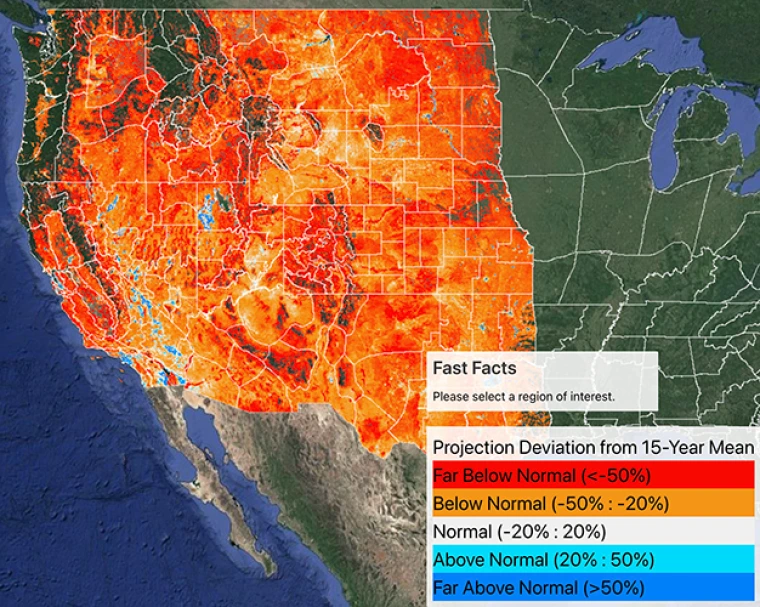
>> It seems like the question “how bad is it” is probably related to what our expectations are. I think on your Fuelcast site you have the deviation from the 15-year mean. How much variability is in the 15-year mean for most locations? There was a farmer in Ellensburg who used to say I’ve lived here for 75 years and I’m still waiting for an average one.
>> Right.
>> Describe that 15-year mean a little bit.
>> Well, it’s easier to describe the mean in terms of variability that we would expect. So, just as an example, in the Pacific Northwest a lot of, you know on the east side especially like in your neck of the woods there, Tipp; I think most for the estimates of variability range from, depending on the site, from 19 to 40%. And so yeah definitely within the last 15 years we would have a mean plus or minus whatever the variability has looked like. Certainly, your viewpoint of how this year compares to all the other years will change depending on the baseline, and the same is true with climate information or whatever. One of the things we’ve toyed with is looking at, instead of just saying the deviation from average, which is just a mathematical thing, why not look at, you know are we below one or two standard deviations. So, using some kind of, you know z-scoring or something like that to show anomalies. That can be done.
>> Right; if you had five years in the last 15 that were, you know, 40% below the mean that would mean that having a 40% below year isn’t all that unusual, but if you’re 50% below the mean, then it would be much more significant.
>> Yes.
>> Or 60 or 70.
>> That’s right, and in that 15-year period we’ve definitely seen some cases, for example, 2018 you know in northern Arizona and that Four Corners region. That was a very deep drought, deeper than what we see today on average but not as wide, and there we saw, you know some 90% reductions, and there was a good bit of area well in excess of 70% reductions in that neck of the woods. There was a lot of drought declarations at that time. You know emergency, emergency declarations.
>> One of the things I wanted to ask you about is in parts of the West too where there’s a lot of cheatgrass, a decline in spring precipitation and therefore invasive annual grass production could correspond to a decline in fire risk. Is there any way to accommodate that in the modeling?
>> Well, certainly it would do that. As an example, we have a general understanding of where the invasive annual grasses occur, whether it be red brome or cheatgrass or some other invasive annual herbaceous species, maybe a Sisymbrium or something. And if we are estimating in those areas of well below average yield; let’s say you’re 500 pounds per acre versus 1500 pounds, which is maybe let’s just say what you might expect. Then the model sees that 500 pounds and assigns a surface fire behavior fuel model accordingly knowing that, number one, it’s annual herbaceous material, and number two, it’s of low-yield, and it would be assigned a relatively benign surface fire behavior fuel model in those cases. We have to remember one thing. One quick thing is that, as you know, fire is a very poor botanist. So, in the end if in the summer time we have invasive annual species but we also have something like, oh, let’s just say Sandberg’s bluegrass that was equally abundant. We might expect similar kinds of fire behavior; not identical but similar. So, I think the function of cheatgrass in those cases is to add the fuel bed continuity not just yield.
>> Right, yeah we definitely see that in most of eastern Washington right now. Significantly less cheatgrass, shorter cheatgrass, earlier, earlier turning, but in some places it seems the perennials are doing all right so far. It’d be nice to get a little bit of rain. To what extent does the [inaudible] satellite imagery or some other form of sensor detect soil moisture, and how does that play in?
>> Well, as you may know NASA has a specific satellite that is used to track soil moisture, and it’s one of the things we pay attention to in our Reading the Tea Leaves monthly webcast that looks at the forage and fuel conditions, and that sensor called SMAP, S-M-A-P SMAP, provides you know plus or minus a snapshot of an estimate of soil moisture every few days, and you can view that information on the crop, soil moisture SMAP. If you just Google those words, you see a very nice viewer there, and that is a 9 kilometer resolution product that also has a 3 kilometer variant, and now with USDA partners has a 1 kilometer variant. And that’s what we use primarily to look at soil moisture conditions and how that might be related to what our forage prediction system looks like. Right now, just as a matter of record, I’m looking at a graph on some data from Park Williams with UCLA showing some soil moisture information, looking at anomalies going way back. It looks like probably maybe the 1900s, and it, according to this information and thanks to Dan McEvoy from the Desert Research Institute for sending me this, it looks like 2021 is the driest on record for soil moisture.
>> Huh.
>> Overall. Overall.
>> Yeah, that’s significant. I feel like there’s talk of drought somewhere every year to the point where some people can kind of tune it out unless they see it, you know very directly in front of them. So, I don’t know that we’ve gotten fully to the question of how bad is it, but I think you mentioned that you have some statistics that indicate this is something, both in terms of the depth of drought conditions the widespread nature of it, that maybe has more significant implications. You know, a regional drought you just buy hay from the next state over, but if all four of the next states over are in the same situation that changes things, and I’m recalling too back to the– I think it was 2012 when there was a pretty significant widespread drought in the south, and it was predicted. It was predicted months out, and there were livestock producers that responded to that proactively and ended up being in pretty good shape, and there were some that did not and really got caught in a bad economic situation. You know, there’s multiple, multiple layers of getting into a bad economic situation, which could include everybody else trying to dump cows at the same time. If everyone feels the pinch you know a little bit too late and then responds all at once and then nobody gets paid very well for their animals, it could mean that you can’t find any winter hay. And so, therefore, you need to get rid of some animals. There’s a number of responses there. So, how– Yeah; how fast is the sky falling and over how many, over how much area?
>> Well, I don’t want to say that the sky is falling, and I would suggest that, at least according to our information; you know right now it’s the soil moisture is very dry as we said, but I do not believe that the conditions we are seeing right now rival those that we saw in the 2011/2012 drought on the southern plains as an example. So, what we have overall is some pretty widespread droughty conditions over about right now 70 to 75% of U.S. rangelands are below average, as I mentioned, in terms of forage production. But we don’t see the draw down in the forage reserves that we saw, at least not in the southern plains in the 2011 and 2012 period. It just seems to be that, you know there’s reductions just about everywhere, but they don’t appear to be quite as deep as in some years passed. Now, locally there are exceptions, of course. I’m hearing anecdotes from my friends and colleagues in California, friends and colleagues in Montana, and places where they are saying no, it’s pretty bad. It’s, you know, the losses are exceeding say 80 to 90% of average. But I think those tend to be kind of localized. One other thing to remember; when we’re talking about drought it’s important to remember that drought is not directly, you know does not relate directly one to one with production and what the expectations of productivity might look like because you got to remember that 20% of our rangelands in the U.S. are properly characterized as bimodal systems, and because of their warm season component, you know C4 , they could respond favorably if monsoons develop in these things. So, it’s a little bit early to call that 20%, and those tend to occur pretty low latitudes in the U.S. and particularly in the southwestern U.S. is where we think about most of the bimodal systems. So, we could see some pulses later on if conditions improve there, but right now, according to our estimates, we’re looking at you know sometime in the next five to 12 days we’ll have about 45% of U.S. rangelands that have reached their peak. So, in those cases, you know especially the cool season areas like eastern Washington, eastern Oregon; the cake is pretty well baked in terms of yield and what we might expect at that time. So, you know in another 10 days we’re going to know with pretty good certainty what we’ve got on the ground available to us in those areas.
>> For those that aren’t familiar with it, I’m not very good at swinging back to providing some URLs, but I want to mention that the Fuelcast.net is the website for Fuelcast, and that you have what is it a weekly now May through September weekly webinar describing the conditions?
>> Yeah, we actually started in April. That’s right. We do the Reading the Tea Leaves once a month. We started in April but projections; so the Fuelcast engine begins four months prior to the peak at every location. So, in a lot of cases, we started January 7th or first week in California and other places where you have really early peaks. So, we’ve been monitoring conditions there for almost five months and, of course, as I said a lot rangelands. The cake is already baked. Cool-season season has past, and what you see is what you’re going to get.
>> Right. If people want to listen to the Reading the Tea Leaves updates, what’s the best way to get to that? Because just if you just type in Reading the Tea Leaves you don’t end up with your site.
>> No, no. There’s about a zillion of those. You need to add the keyword like USFS or Reeves or Rocky Mountain Research Station, any of those in conjunction with Reading the Tea Leaves will get you there.
>> Okay. Going back just a few more details on the current situation. If, if we have significant drought conditions this year in a specific geographic region and that’s, you know back to back to back to back with several years of conditions like that; how would you describe that situation being different than, for example, if it’s the first year of drought after having multiple years of, you know near average precipitation?
>> Well, this is a very important consideration, and it’s something you would consider even if let’s say it wasn’t a drought but a fire as an example. I think in a lot of cases when we’re seeing back to back to back reduced forage conditions, as we have seen now in the Four Corners region, you know since 2018 things haven’t been that great, and in a lot of cases they’ve been very bad back to back to back, and in those situations I think that a lot of people are considering more rest for the next year. So, even if conditions improve next year, some people, some managers may choose to, you know stay at a reduced level of stocking just to allow for some recovery. I should mention, Tipp, we’re going to have in about one week, maybe a week and a half, we’re going to host a one-hour webcast on the subject of what are managers doing right now to cope with these kinds of situations, and by managers I’m talking about on the forest service primarily who manage those federal grazing permits. How are they working with permittees to reconcile these things, and what are the types of things that people are talking about and thinking about to cope with this, especially when we’ve had back to back years? So, there’ll be some specific ideas from managers that may add to what I just said.
>> Yeah, I mean to ask you; does the forest service handle that kind of on a region by region or local basis, or are there specific triggers in terms of, you know reductions in expected forage availability that trigger an automatic response within a district?
>> Well, my knowledge on that on the triggers is pretty limited. I do know that at least in region three, which is primarily New Mexico and Arizona, there is some triggers related to the SPI, the Standardized Perception Index, and when that occurs I’m not sure exactly what the rules are or what the type of playbook they have. Other than that, it’s usually a case by case basis depending on not only the forage conditions but the type of relationship people have with their stakeholders. So, there’s a lot of factors that influence that decision and what to do.
>> Right. Well, let’s transition to talking about how people might respond. I’m a fan of making localized decisions and not just taking blanket recommendations from somebody who doesn’t live in a person’s neck of the woods. So, I’m not going to presume to make recommendations for somebody who’s living in South Texas; however, you know when there are a number of possibly useful responses, management responses when conditions are like this, and I think it’s worth talking through some of what those might be. You know, both in the interest of protecting ranch finances, in the interest of protecting the future productivity of a person’s rangeland or pasture, in the interest of avoiding, you know having enough stack disturbances that cause a range site to cross an ecological threshold, to pass this tipping point where now we’ve got potentially a degraded but stable state; a new vegetation assemblage that’s not going to want to go back the other direction to what you had before. We want to avoid all of those things, and the list of possibilities for how somebody might respond could be pretty long. But I think it’s worth talking through some of those just to throw out some ideas for folks who maybe have not even considered how they might respond yet. You know, as a range person one of my concerns is if you have drought pressure coincident with heavy grazing, and what might not ordinarily be heavy grazing, but the same stocking pressure when you have forage short conditions may turn out to be heavy grazing pressure in an area where you ordinarily would be applying a light grazing pressure just by virtue of the fact that there’s a significantly less forage. And that can cause passing this tipping point where we end up with something that we don’t want. So, maybe we’ll bring Shannon in now and talk about some of the, some of the possible responses, but first Matt, you know what as somebody who does both data and range management and really has one foot in both worlds, you know what would be your immediate thoughts as to recommendations?
>> Well, I’m a little hesitant to recommend anything, but it seems to me that one of the easiest; well, not easiest but one of the immediate things that comes to mind is think about carefully balancing the forage production with potential use, and if that means you know a reduction of the number or a different type of animals perhaps than you might have already considered, maybe that’s what you should do. I’m not as much in tune with all of the arsenal of what to do during drought as say someone like Shannon or yourself might be, but that’s I think overall what most people are talking about. I know, for example, in– Oh, in the Dakotas, South Dakota and North Dakota, they’re talking about you know reductions of authorized amounts somewhere around 30%, and that’s not what– You know, that’s pretty widespread. I think that’s about an average value that I’ve been hearing about talk about. Then in eastern Montana I’ve heard some producers I’ve spoken with also indicate, you know selling perhaps somewhere around 30% of what they had. They didn’t identify the types of animals they were selling. So, it looks like across the board a lot of people are looking to just reduce herd size.
>> Yeah, Shannon maybe here’s a direct question. I feel like I recall hearing Harlan Hughes, who is I believe an economist for North Dakota State University. Maybe he’d been multiple places, but for some reason I have in my head that he was with North Dakota State. I remember him saying one time that people shouldn’t be so scared of selling cows, and that there’s, you know there’s a lot of reluctance to temporarily reduce herd size; that he felt like resulted in a lot of people getting into a bad economic situation. And I think at the time he was advocating in response to drought selling at a time when you could get decent prices for cows. Instead of waiting until everybody else is trying to sell cows to get ahead of it and reduce herd size. Have you heard–? Am I recalling correctly about Harlan Hughes or maybe you don’t know, and should people be not so scared about selling cows or not so reluctant to reduce herd size?
>> Yeah, Harlan is a famous economist, and I do believe he was at North Dakota State. And the issue now is you’re already behind the eight ball because those sales have already been occurring. There’s a number of reports of weekly sales going to biweekly on livestock auctions to handle the volume.
>> Oh, wow.
>> Of destocking; that’s already occurring, noted in North Carolina or North Dakota and elsewhere across the west. And so, there’s a lot of that calling going on. Obviously a lot of management strategy on how you approach that problem, and then to help producers respond to this adverse risk of increased calling in response to weather sales, there’s a couple of programs that have been setup already in place and they’re programs that have been defined to function anywhere in the United States so that they could have them on the books and ready to roll out in this type of situation. And directly related to the destocking decision is tax rules; so you can defer the income you received on those sales so you don’t have to pay a tax on that increased revenue. And those are pretty complicated programs. You’ll have to engage your tax advisor to help you work through those because they’re not, they’re not without some risk in that you have to reinvest those monies within a certain amount of time. You defer the extra income that you received above normal calling, and then in one or two years, depending on the programs you take, you have to reinvest those by purchasing animals, breeding stock. And so, people listening to this, if you’re in an area where your drought impacts are less; well, if I was if I had an opportunity I’d be building up those heifers and they’re going to be worth quite a bit of money because, as Matt mentioned, that’s a widespread drought. And so as people look to reinvest those monies, there’ll be a strong demand in a year and two years for those breeding animals.
>> Yeah, can you name again what’s the specific name of the program that people should check into?
>> Okay, that’s drought weather-related sales of livestock in the IRS code. So, I don’t think in this particular case the producers– The producers need to seek advice from their accountants. They’re probably working with an accountant to file their tax statements, and he’ll be well versed in the IRS codes. I could give you the Internal Revenue code numbers, but you don’t really want to read on that. That’s their– That’s their specific expertise. Just I think it’s important to know you can defer the income, but you have to reinvest that income and you have to account for that. But there’s, for producer related action, there’s definitely a producer related action to help offset those drought conditions and that’s called the Livestock Forage Program. The Livestock Program is often abbreviated as LFP, and that’s administrated through the Farm Service Agency on a county by county basis and they have maps. You could Google those maps to see the extent of the payment. What it deals with is that it provides up to five months of payments at a specified rate per animal and provides producers an income source or a cash flow that allows them to help purchase. It’s designed to help purchase increased hay and increased hay cost and help offset that dramatic effect of having to find new feed for your animals.
>> What would you say are the downsides of reducing herd size?
>> Yeah, it’s– You know, you’re calling those, that herd that’s been on your ranch and adapted to your conditions and knowing how the range lays as far as water sources and getting across different areas. And so you have to take all that into account because when you re-buy those animals you’re going to be purchasing new animals that are outside of your herd. So, biosecurity risks come into play on that as well as just the dynamics of individual cattle performance.
>> And you’ve mentioned already some of the challenges of trying to reduce herd size in terms of being a little bit behind, behind the game at this point as far as getting paid for something. Do you have any information about what the hay situation looks like? So, say somebody decides I’m going to try to ride it out. It’s not quite so catastrophic where I’m at. I feel like I’ve got– I’ve been careful about grazing and have maybe some stockpiled forage or pastures that haven’t been used very heavily for several years, and I think I’m going to ride it out, but that’s also going to require maybe, you know 30 to 45 days longer feeding period if a person runs out of forage this fall. What’s the hay situation like?
>> Yeah, replacing that roughage in the diet through pasture or hay is a dynamic market, and the hay particularly is more dynamic this year, and the hay market it really stems from risk associated with exports and how the export market is a primary driver on price. And it’s interesting this year because it’s carrying over from 2020 and the COVID year and the implications on transportation and what was purchased for export and who’s buying and who’s trying to make by. In summary, the China has really increased their purchases of forage through 2020. If it wasn’t for China’s increased purchase of forages we would have extra stocks, but China really stepped up to a record level of hay purchases from the United States. And also a dynamic on China is they have a trade dispute with Australia, which they source hay, and because of that trade dispute with Australia they’re turning attention to trying to contract more hay from the United States. And what’s also a factor on that hay market is this drought in the first cutting, and if you look across the west there’s a lot of areas that are surface water irrigated. A large number of acres are groundwater irrigated and dryland. And so you look at the drought, you see how those impacts are impacting the irrigation water supply. If you’re mining the groundwater, that could be a really good strategy this year to produce, you know high desirable quality hay. And also with the drought, as people lay down that first cutting, you know even in the Columbia Basin, we have seasonal rains that really impact that first cutting quality, which then increases– If it rains on it, it increased the feeder, the amount that goes to the feeder market as opposed to if it’s put up first cutting very green, that’s a very desirable export quality hay and it’ll garner that price. So, the hay market is pretty tight. The storage statistics are show that the hay market is tight. The droughts showing the hay market is going to be tight in production. So, trying to secure that hay source, if that’s going to fit into your feeding plan, hopefully you’re able to secure that source and tie that down soon.
>> Yeah and the other risk that we’ve mentioned before is you don’t– If you can avoid it, you don’t want to sell low and then buy high.
>> Yeah.
>> It’s like the old joke about how to make a fortune; how to make a small fortune in the cattle business.
>> Yeah.
>> You start with a large fortune and then buy some animals. If, you know if sales are already going on now, destocking sales, what are cattle prices looking like say today?
>> Yeah, so that’s real interesting. The current feeder market is a little bit soft, and it’s a little bit soft because of the corn market. Because typically those cattle would not have been marketed as feeder animals til later in the year, or they would have gone to backgrounding operations to take advantage of forage. But since the drought, those opportunities have dried up. And they’re being forced to look at, well; I might have to supplement feed these animals to earlier than what I thought. And with the high corn prices this year, that’s impacting the current market. But if you look for the fall calving or fall sales, spring calving/fall sales, those markets are holding pretty steady in the futures market because next year’s corn crops– So far, the growing conditions are been rating good. So, the corn crop for next year is looking pretty good. It’s holding the future’s price is up, and so if you can– So, now I guess your strategy that you have to look at is you mentioned, you know you want to sell before the rush. I mentioned that now you’re already probably behind the rush. So, now you’re looking at well, can I come up with a strategy that allows me to sell them later in the year where the prices are being maintained.
>> Right. Well, I think we’ve probably said enough at this point to keep people busy thinking and scratching pencils for a little while. Just a couple of final thoughts on tying together some of these economics implications with range/pasture implications. You know, in response to a drought or even a multiyear drought it may be a good idea to either use reduced stocking rates or offer, you know various individual pastures or individual range units a little bit of rest or a couple years of rest. You know, one way that that might be accommodated is by not buying back cows or heifers at the time that everybody else does and just kind of sitting on things for a little while. I realize, you know, many people are going to need to have some cash flow, but it would be worth thinking about how that could be creatively done in a way that might allow some rest because it really is pretty important to avoid overusing and damaging particularly the perennial plants in what may be, you know, healthy range going into a drought situation. And not overusing those plants is pretty critical to protecting the future productive capacity of that range ground. Do you want to add anything to that, Matt?
>> Nope; I think you covered it, Tipp.
>> Okay, well in that case I think we’ll probably stop there. Thank you guys for joining us, and we will put in the show notes the links to all of these different programs and websites that we’ve mentioned. And so if you haven’t before, be sure to look at the show notes and maybe we’ll have an update on this a little bit further into the season. Matt and Shannon, thanks again.
>> You’re welcome.
>> Thank you, Tipp. It was good to talk with you again.
>> Thank you for listening to The Art of Range Podcast. You can subscribe to and review the show through iTunes or your favorite podcasting app so you never miss an episode. Just search for Art of Range. If you have questions or comments for us to address in a future episode, send an e-mail to show@artofrange.com. For articles and links to resources mentioned in the podcast, please see the show notes at artofrange.com. Listener feedback is important to the success of our mission, empowering range line managers. Please take a moment to fill out a brief survey at artofrange.com. This podcast is produced by Conner’s Communications in the College of Agricultural, Human, and Enroll Resource Sciences at Washington State University. The project is supported by the University of Arizona and funded by the Western Center for Risk Management Education through the USDA National Institute of Food and Agriculture.
>> The views, thoughts, and opinions expressed by guests of this podcast are their own and does not imply Washington State University’s endorsement.
[ Music ]
